Mining Transactional Data with Log Analytics
-
Share


Abstract
The absence of a common/standard practice for logging across different software platforms makes it difficult to draw meaningful insights from logs. Organizations need an approach to collecting large volumes of data, generating insights, and visualizing. Coforge log analytics solution can provide the required architecture and intelligence to resolve your problems quickly.
Impact of Disparate Systems
Logs are generated by various applications sitting on top of programmable devices. ( application, with its unique technology architecture, has a different mechanism to generate and store logs. This creates many different formats and a vast repository of logs to handle.
The function of a log analyst is to unify these disparate formats into a common reporting language. The reports thus generated represent different activities of the heterogeneous environment:
- Customer behavior
- Compliance issues
- System functionality troubleshooting
- System vulnerability
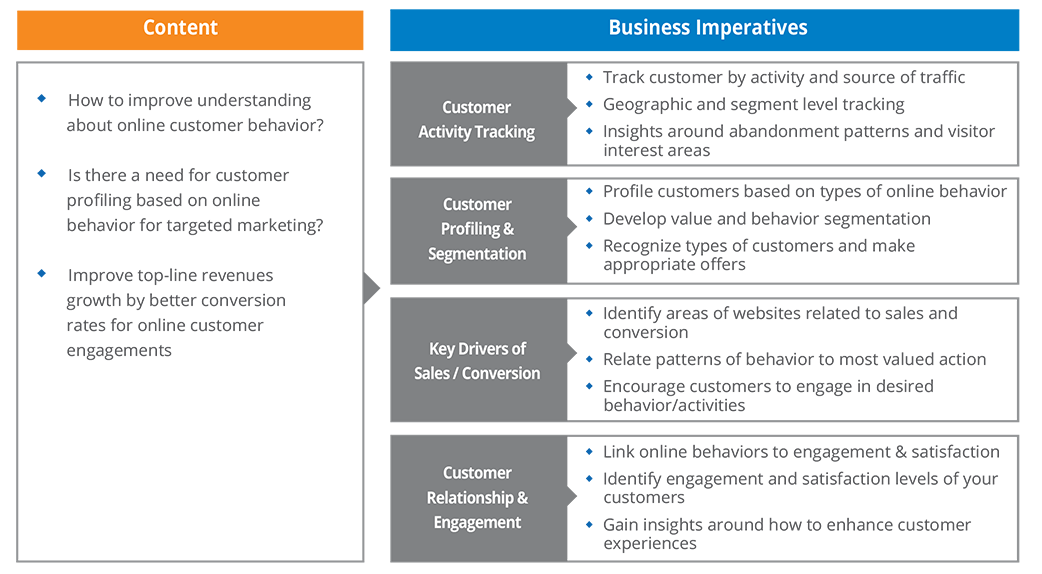
Business Imperatives: Consumer Engagement
Architecture: Fit-for-purpose Features
Coforge uses Opensource Elastic Stack to synthesize insights from the huge volume of logs for business critical functions.
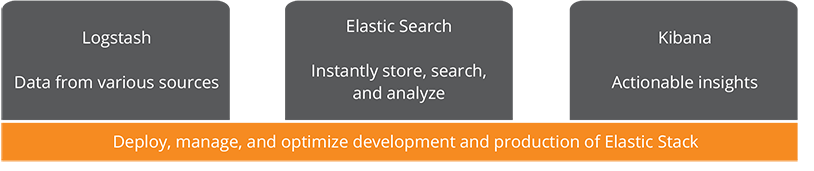
Elastic Stack is a widely accepted solution in the industry and we at Coforge have highly experienced SMEs and engineers to understand, implement, maintain, and customize it as per client’s need. The engineers ensure:
- Precise configuration according to the client’s environment
- Seamless connectivity across different components
- Availability of stack at all times
- Fine-tuning of the system to run with optimum resources
- Meeting of SLAs
- Right fit of components into the current IT infrastructure
On the other hand, the team of SMEs ensure:
- Correct selection of KPIs that are vital to the business
- Customization of business metrics according to users work profile
- Upgradation of KPIs according to evolving business needs
- Rolling up the KPIs to the highest level of business metrics that define profitability
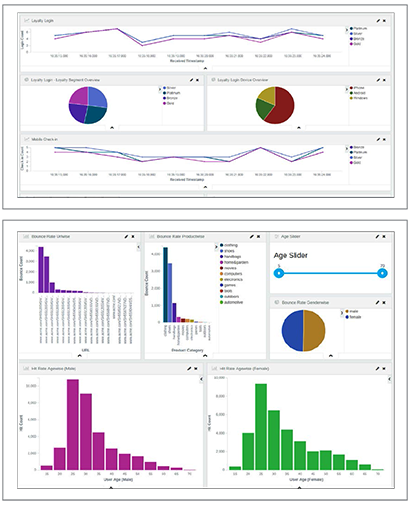
Solution
The Coforge team creates a highly customizable dashboard with graphically rich views. Log searches can now be leveraged by selecting KPIs and other analytical metrics. Visualizations can be added to focus on certain categories, products, or demographics.
Let’s assume that our data includes information about customers of an airline. By selecting segment data, we can find out exactly which segment is most engaged with the organization. To capture relevant data, we set the following fields and filters:
- Time for login and check-in
- Platform to identify the means used by loyal customers
- Fare trend line by selecting appropriate visual with feature
- Category of product to increase conversions and identify the reason why the customer did not end up purchasing the product. The focus is on individuals in the age group of 20-35 and resolving problems (navigating to next page) in real time.