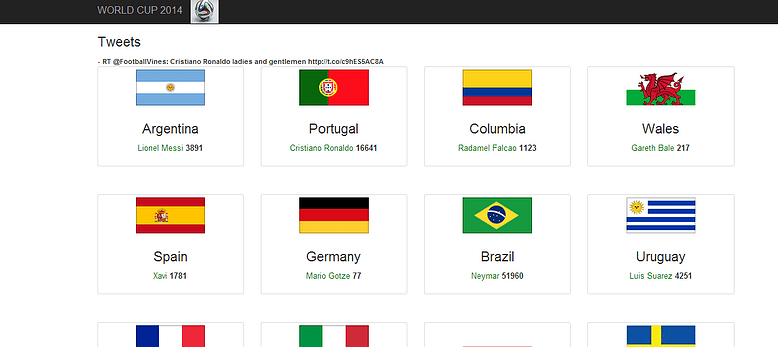
There are millions of soccer fans across the world that follow the WorldCup closely, following their favorite footballers, teams and watching every game. Twitter has become one of the biggest sources of information for the world. There is lot of emotion and sentiment in the tweets. A lot of companies work towards deriving value out of these tweets and generate business. Sentiment Analysis is one such area, where the people’s attitude towards a player or a team are measured in real-time. Football teams can make use of this and plan their next move (could be as simple as replace a player X with player Y). One other thing that could be done is trend detection. For instance there were few trending things like Messi’s birthday and Ronaldo’s haircut that were very popular among the community. So a company could detect this trend and do targeted sales – like selling T-Shirts with Messi’s photo print. The most popular application of this data is in betting. The real-time tweets, historical game stats and player stats can be used to build predict the outcome of a game. In this application, I have explored the aspect of Social Analytics – to determine the most popular players in each team in real-time and trend detection.
Dashboard

- Flume-NG
- Twitter4j
- HBase
- Redis
- Bootstrap
The design should cater to these requirements, from the processing perspective.
- Distributed
- Highly-Available
- Load Balanced
- Handle throttling and Impedance mismatch
- Real-Time
- Loosely-Coupled
- Reliable
The application cannot run in a single node and it has to be distributed across nodes. Twitter streams consist of thousands of tweets arriving every few seconds. These have to be handled reliably, without the system crashing or losing any of the data. We will have tweets arriving from multiple machines. We would expect that each and every tweet is counted accurately (Reliable). If any of the machines in the application pipeline fail, transparently other systems should be able to take up their new roles (fail-over). The systems involved in the pipeline should be independent of each other as much as possible (Loose Coupling). The application might receive tweets faster than it can be consumed (the dashboard web-application). This leads to impedance mismatch (fast producer, slow consumer) and throttling. Application should be designed for handling this. The dashboard should display the tweet count in real-time (maximum one second delay allowed).
Architecture


Twitter4j
Twitter receives more than 500 million tweets every day. This data is made available to the general public, for research and experimentation. Since the volume of data is pretty is high, twitter only provides a random sample of 1% of those tweets. On an average, we would receive anywhere around 5 million tweets per day. This translates to around 3K to 4K tweets per minute. Twitter also provides 10% sample as a paid service. If an individual or a company is interested in consuming these tweets, Twitter provides “Twitter Streaming API”. We can call this API in Java using a library called Twitter4j. First we need to visit http://dev.twitter.com and register an application with Twitter. This provides us with the OAuth tokens required for connecting to Twitter. They only allow a maximum of two connections per system.
Flume

Flume-NG
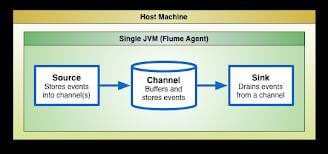
Flume-NG is a distributed, reliable, aggregation framework operating on streaming data. It can consume streams from twitter, log files, RSS feeds, Tailing,etc. It can write to multiple sources like Hadoop HDFS, HBase, MongoDB, etc. It has a concept of Agent, which is a Single JVM process and contains Source, Channel and Sink. Channels can be File, Memory or Database. The File channel is the recommended one, if we can’t tolerate any data loss. The file channel uses memory-mapping, pointers, check-pointing and WAL (Write-Ahead-Logger), to ensure fast access. If the tweets are arriving faster than they can be consumed by the downstream applications, then they are stored reliably in the Channel. The communication between the Client and the Channel is supported by batching and transaction support, hence it’s reliable and fast. Multiple Agents can be configured to form a topology, and data can flow through these multiple agents. Flume uses Avro (Hadoop’s serialization framework) as a default standard for this form of agent to agent communication. So what are the limitations with this architecture? It cannot guarantee ordering of messages (one node or multiple-node). And it doesn’t have any transforming capability, it can only do aggregation.
Hbase

HBase
HBase is a popular column-oriented NoSQL store. It gives millisecond latency for writes and reads, it’s one of the fastest databases for doing range based scans, it’s extremely fast in writes, and lastly it’s strongly consistent (if we use multiple HBases and read from any machine, we get the same data).
Redis

Redis
Redis is a very simple lightweight key-value based NoSQL store. It’s immensely popular and even used by Twitter to store each user’s timeline. Unlike other key-value stores, Redis is a complete data structure engine. It has map, list, set, sortedset, and pub-sub. The distributed increment feature is very useful in scenarios like implementing facebook like count. We would use it to maintain stats per player. It’s extremely light and can be used in distributed mode as well (Redis Shard). Jedis is a Java client for connecting to Redis server.
Implementation
- There are two nodes, each of these connect to Twitter using Twitter4j and read the streams. I have identified 50 top players in the world cup across teams, and the tweets are filtered for them. The rate of arrival of tweets is a few hundreds per second. But it can quickly shoot up in the event of incidents like winning a match, breaking news, etc
- I have run the Flume-NG client SDK on two machines, which is a simple Java application that connects to twitter and sends tweets as events to downstream layers
- The Agent machine is configured to open a port 4414 for consuming the Avro messages.
- It uses a file channel to store the events.. The data is stored in HBase in a single table called “Twitter”, and it has a column-family “details”. The Row-Key is a factor of time-stamp.
- Every second a job runs and does a range based (time-series data) scan for tweets. The data for every second is required to be presented to the end user in the dashboard applications. The tweet counts and sampled tweets are stored in Redis.
- The web-application is a simple bootstrap application that reads the Redis database and converts to JSON. This JSON data is presented on the dashboard. Apart from this, we also do random-sampling of the tweets and use it for trend detection.
If you would like to find out more about how Big Data could help you make the most out of your current infrastructure while enabling you to open your digital horizons, do give us a call at +44 (0)203 475 7980 or email us at Salesforce@coforge.com
Other useful links
Big Data Analytics in the Travel Industry
Your data goldmine - how to capture it, hold it, categorise it and use it
How Big Data can bring big improvements to the oil, energy and utilities sector
Related reads
About Coforge
We are a global digital services and solutions provider, who leverage emerging technologies and deep domain expertise to deliver real-world business impact for our clients. A focus on very select industries, a detailed understanding of the underlying processes of those industries, and partnerships with leading platforms provide us with a distinct perspective. We lead with our product engineering approach and leverage Cloud, Data, Integration, and Automation technologies to transform client businesses into intelligent, high-growth enterprises. Our proprietary platforms power critical business processes across our core verticals. We are located in 23 countries with 30 delivery centers across nine countries.


