
As the global banking industry enters a new era of heightened uncertainty, marked by evolving regulatory landscapes, digital transformation mandates, and post-pandemic market volatility, cost optimization has become a strategic necessity, not just a financial exercise. To remain competitive, banks must move beyond cost-cutting to adopt a more sophisticated understanding of cost structures - where and how money is spent, and how it translates into value.
This blog delves into a comparative analysis of the FY2024 cost structures of five leading global banks - JPMorgan Chase (JPMC), PNC Financial Services, Lloyds Bank, Deutsche Bank, and Commonwealth Bank of Australia (CBA). By unpacking how these institutions allocate and manage Noninterest Expenses (NIE), we gain insights into their operational efficiency, digital maturity, and return on equity (ROE).
Understanding the Anatomy of Bank Costs
Noninterest Expenses, or NIE, represent a bank's core operating costs, excluding interest expenses related to lending and borrowing. These include personnel costs, technology investments, facility operations, compliance and legal fees, marketing, and other discretionary or exceptional expenditures.
Broadly, NIE can be grouped into six categories:
- Personnel Costs (30–50% of NIE): Salaries, benefits, and incentives, often the largest line item.
- Technology & Equipment (15–20%): Costs tied to digital transformation, cybersecurity, legacy modernization, and infrastructure.
- Occupancy (4–10%): Branch networks, office spaces, and associated real estate costs - generally on the decline due to physical footprint optimization.
- Regulatory & Compliance (3–15%): Expenses for risk management, audits, and adhering to increasingly complex regulatory frameworks.
- Marketing & Professional Services: Variable expenses reflecting strategic priorities.
- Other Expenses: A volatile category encompassing litigation, FDIC fees, restructuring charges, and more.
Comparative Snapshot: FY2024 Performance Indicators
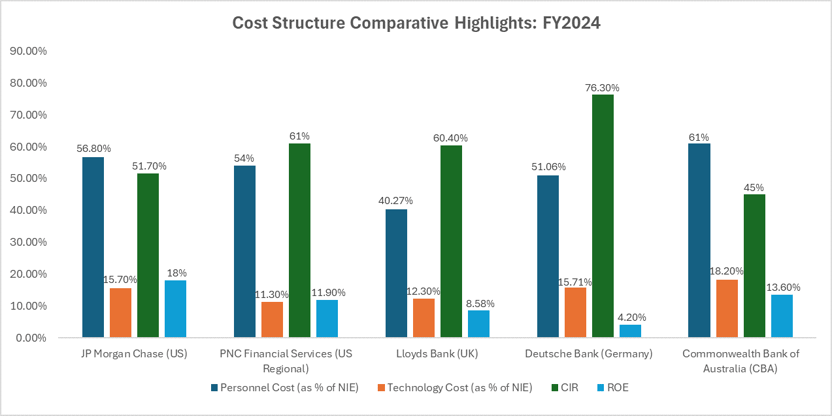
What stands out in the FY2024 data is that cost efficiency is not simply a matter of reducing expenditure—it's about strategic allocation and revenue leverage. Let’s explore some standout observations from the comparative review.
Insights & Implications
A deeper look into the FY2024 data reveals that efficiency is not simply about cutting costs; it's about making the right investments:
| Metric | Industry Benchmark |
|---|---|
| Personnel (% of NIE) | 30–50% |
| Technology (% of NIE) | 15–20% |
| Cost-to-Income Ratio (CIR) | ~52% (Global Avg) |
| Return on Equity (ROE) | 10–15% |
1. Tech Spend Only Drives Efficiency When Strategically Aligned
Commonwealth Bank of Australia (CBA) and JPMorgan Chase both allocate around 15–18% of their NIE to technology, and they reap the rewards. These banks not only report the lowest Cost-to-Income Ratios (CIRs) but also rank among the highest in ROE. This suggests that disciplined, purposeful investments in digital capabilities can drive both efficiency and profitability.
Conversely, Deutsche Bank, while matching the same tech spend ratio (~15.7%), lags significantly in both CIR and ROE. The lesson? Spending on technology is not a magic bullet—it must be part of a coherent strategy that includes modernization, integration, and effective execution.
2. High Personnel Costs Aren’t Always a Red Flag
CBA again defies conventional wisdom by maintaining the highest personnel cost ratio (61% of NIE) while boasting the lowest CIR at 45%. The takeaway is clear: it’s not how much you spend on talent, but what you achieve with it. When banks invest in high-performing teams, empower them with the right tools, and integrate them into customer-centric workflows, the payoff can be substantial.
JPMC follows a similar trend—relatively high personnel and tech spend, yet strong financial returns—indicating a mature, synergistic operating model.
3. Striking the Right Tech-to-Talent Balance is Critical
An interesting contrast emerges between CBA and Lloyds. While CBA exhibits an optimized tech-to-people spend ratio of 30:70, Lloyds has lower personnel costs but modest tech investments. The outcome? Lloyds lags behind in efficiency and profitability. This underscores the importance of calibrating both human and digital capital to support differentiated banking experiences and operational scale.
Strategic Recommendations for Future-Ready Banks
In light of these findings, what should banks prioritize as they rethink their cost structures for a digital-first future?
1. Redesign the Tech Operating Model
- Focus on value realization, not just expenditure. This includes cloud-native platforms, modernizing legacy systems, and consolidating fragmented architectures.
- Establish governance frameworks that link IT investments to business KPIs through agile delivery models and ROI-driven decision-making.
2. Reimagine Workforce Strategy
- Shift from viewing employees as cost centers to value generators. Upskill teams in AI, data analytics, product management, and compliance.
- Automate repetitive tasks using AI and workflow tools to elevate the role of human capital in high-value functions like relationship management and complex underwriting.
3. Modernize the Cost Structure
- Reduce fixed costs by leveraging the cloud, outsourcing non-core processes, and adopting shared service models.
- Simplify products and services to eliminate redundancy, lower service complexity, and minimize dependency on legacy systems.
4. Adopt a Holistic Efficiency Culture
- Embed a culture of zero-based budgeting, continuous improvement, and operational discipline across all business lines.
- Encourage transparency and accountability in cost allocation and performance outcomes.
5. Benchmark Continuously
- Regularly evaluate internal efficiency metrics against industry peers to identify performance gaps and best practices.
- Use external benchmarks and advanced analytics to drive transformation initiatives with quantifiable outcomes.
How Coforge Can Help
Coforge empowers leading financial institutions to transform cost structures into competitive advantages. Our approach combines deep domain expertise with cutting-edge technology execution to help banks:
- Optimize technology investments through cloud migration, platform modernization, and agile delivery.
- Elevate workforce productivity by embedding automation, AI, and digital tools across functions.
- Enable data-driven decision-making with advanced analytics and real-time dashboards.
- Accelerate compliance transformation through RegTech integration and proactive risk management.
- Achieve sustainable cost takeout via operating model redesign, shared services, and digital-first processes.
In an industry where the margin for inefficiency is narrowing, Coforge partners with banks to build future-ready cost frameworks designed not just to save but also to scale, compete, and lead.
Conclusion: Cost Optimization as a Competitive Differentiator
FY2024 has shown that the banks best positioned for future success are not those that merely minimize costs, but those that understand the strategic intent behind each dollar spent. Whether it’s investing in cloud and cybersecurity, building agile teams, or redesigning the product architecture, winning banks are those that continuously align their cost structures with long-term growth, resilience, and customer value.
As we move deeper into an era of digital disruption and economic unpredictability, cost optimization must evolve from a finance-led function into an enterprise-wide mindset. The ability to flex operating models, scale efficiently, and adapt to new risks and opportunities will define the next generation of global banking leaders.
Need help? Contact our BFS experts to learn more about decoding cost efficiency in global banking.
Related reads


About Coforge
We are a global digital services and solutions provider, who leverage emerging technologies and deep domain expertise to deliver real-world business impact for our clients. A focus on very select industries, a detailed understanding of the underlying processes of those industries, and partnerships with leading platforms provide us with a distinct perspective. We lead with our product engineering approach and leverage Cloud, Data, Integration, and Automation technologies to transform client businesses into intelligent, high-growth enterprises. Our proprietary platforms power critical business processes across our core verticals. We are located in 23 countries with 30 delivery centers across nine countries.