
Many data and analytics projects include numerous processing phases, such as data cleaning, data preparation, modelling, and evaluation. Completing these projects can take weeks, if not months. This means that it is essential to have a structure or regular method.
In this post, we will discuss how the CRISP-DM framework can be used to establish new data-driven projects or be used as the life cycle to follow during the monitoring of any simple or complex analytical projects.
The CRISP-DM framework
The CRISP-DM (Cross Industry Standard Process for Data Mining) framework is a standard process or framework for solving analytical problems. The framework is comprised of a six-phase workflow and was designed to be flexible, so it suits a wide variety of projects. An example of this is that the framework actively encourages you to move back to previous stages when needed.
The CRISP-DM framework or methodology is commonly used as an open standard strategy for developing methodological business proposals for big data projects regardless of domain or destination. The model also provides opportunities for software platforms that help perform or augment some of these tasks.
To help understand the approach before diving into any analytical or technical descriptions, here is a graphic of the six-phase process. This helps illustrate how each phase assists us in planning, organising, and implementing our projects.
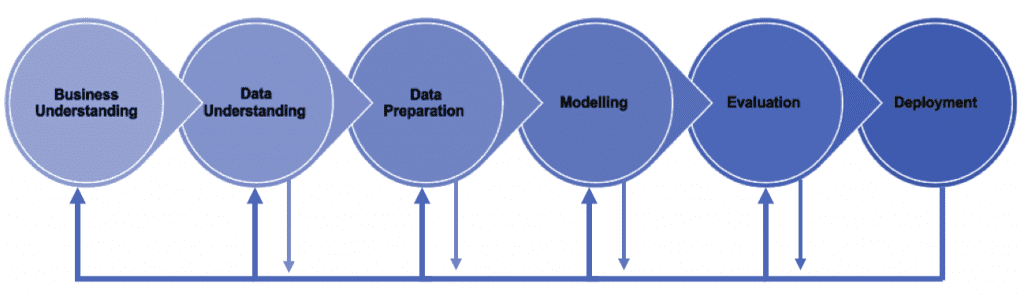
If we assume you're tackling a typical Big Data project, the procedure will go something like this:
- Business understanding - Define the project's objectives.
- Data understanding - Set the parameters for the data and data sources and determine whether the available data can meet the project's objectives and how you'll achieve them.
- Data preparation - Data transformations where it is required for the Big Data process.
- Modelling - Choose, build and execute the algorithms that meet the project's goals.
- Evaluation - The findings are examined, reviewed and aligned against the objectives.
- Deployment - The model is launched, people are informed and strategic decisions are made in response to the findings.
Let's take a closer look at each of the six stages:
Business understanding
Understanding the objectives and the scope of the project is the frameworks first step and clearly the most important. This involves learning and exploring the pain points and using them to construct a problem statement. For us, this is usually a clients issues, problems, strategic/tactical/operational plans, goals etc. We can then use the problem statement to dive into the data and gain a better understanding of the business.
As an example, consider the case of a vintner (wine maker) who needs to estimate the quality of his wine. He might be interested in forecasting a wine's quality based on its characteristics. To be more specific, we could be attempting to respond to the following business questions:
- What are the different types of wines offered at the store?
- Can a wine's price influence its quality?
- Can the quality of wine be predicted with fair accuracy depending on its attribute?
Data understanding
The framework's second step focuses on gathering and understanding data, which lets us get a feel for the data set. The data comes from multiple places and are typically both structured and unstructured. This data must be helpful and easy to comprehend, and oftentimes in this stage, some exploratory analysis is done to aid in deciding whether or not the data found can be used to help solve the business challenge. To ensure this happens, returning to the business understanding phase can be fruitful when trying to understand the data, the problem, what we are looking for and trying to model.
To continue our theme, here is an example of a dataset (wine quality) that has been taken from the UCI machine learning repository, found here. Take a moment to read it and come to your own conclusion, does the data set give us the information we need? or are the questions we are asking relevant to the overall goal?
To proceed past this phase, we must be able to explain the data set's contents and research insights to acquire a better understanding. To do this we can even create visualisation graphs to help us better comprehend data trends and acquire more valuable insights.
Data preparation
The most intensive and time-consuming process is data preparation. The data needs to have everything that's needed to answer the business questions and getting input from stakeholders can help to identify the variables to explore. All in an attempt to indicate which models in the next phase need to be used to derive actionable insights. In general, the data isn't always as clean or as useful as one would hope. As a result, data cleaning and other activities are included in this phase. Some of the steps involved are:
- Cleaning the data - Removing incorrect, corrupted or incorrectly formatted data, duplicates.
- Data integration - Dealing with issues like joining data sets, editing metadata, correcting small data inconsistencies like nomenclature.
- Filling the data - Imputing the values according to the dataset.
- Transforming the data - Applying transformations if any are required. Examples being: Generalisation of data, normalisation/scaling of attribute values, aggregation, feature construction.
- Data reduction - Making the data easy to handle whilst producing accurate results.
- Feature engineering - Creating the right features to improve the accuracy of the analytical model.
Modelling
This is one of the most important phases at the heart of a data analytics project. This is where the various modelling techniques are chosen and implemented. Data modelling primarily involves two tasks:
- Understanding the scope of the problem and selecting appropriate models to solve it.
- Choosing the right techniques that will predict the target most accurately.
The techniques can involve clustering, predictive models, classification, estimations and others. Even combinations of options can be used to find the most accurate prediction. To get this right, we can break down the two tasks into the following steps:
- The first step is to choose the modelling technique or the series of modelling techniques that are going to be used.
- Following that is a training and testing scenario to validate the quality of the techniques used.
- Afterwards, the tuning and optimisation of multiple models will be completed based on the predictions.
- Finally, the models will be evaluated to ensure that they align with business objectives.
Evaluation
This is the framework's fifth step. This phase uses multiple statistical approaches including: ROC Curve, Root Mean Square Error, Accuracy, Confusion Matrix, and other model evaluation metrics. This is to help discover whether or not the model only answers facets of the questions asked, if the questions need editing, are there things that aren't accounted for etc. If these kinds of issues are appearing, there might be a need to move backwards to a previous stage first to ensure the project is ready for the deployment phase.
This sounds similar to some of the steps in the modelling phase, doesn't it? However, even though we mentioned evaluation in the modelling phase, the modelling and evaluation phases are separate and both test models until they produce relevant results. Instead of reviewing just for quality and aligning with current business goals the evaluation phase can also be used to look at the whole progress so far, evaluate if everything is on track or if the analysis and business goals are actually something else.
Deployment
This is the framework's last level. Now the model is accurate, reliable and insightful, data can be fed into the model. Then we can decide how the results will be used. Commonly they are used to inform business strategies, tactics, actions and operations. The work doesn't end here though, deployment requires careful thought, launch planning, implementation, informing the right stakeholders and ensuring that they understand. To help with this, there are a variety of methods to help the roll-out when it's ready to be deployed:
- Traditional methods using schedulers.
- Tools such as Flask, Heroku, GCP, AWS, Azure, Kubernetes etc.
What do you get out of this approach?
Now we have given a brief intro to the approach. Here are the primary benefits of using the CRISP-DM approach for Big Data projects:
Flexibility
No team can escape every hazard and misstep at the start of a project. Teams frequently suffer from a lack of topic knowledge or inefficient data evaluation models when beginning a project. As a result, a project's success is contingent on a team's ability to rethink its approach and improve the technological methods it employs. As a result, the CRISP-DM approach's flexibility is great. Its high level of flexibility, helps to enhance the hypotheses and data analysis approaches of teams in the short-term and over time.
Long-term planning
The CRISP-DM approach allows for creating a long-term plan based on short iterations at the beginning of a project. A team can construct a basic and simple model cycle during the initial iterations, which can be easily improved in subsequent iterations. This idea allows a previously designed strategy to be improved after new facts and insights are obtained.
Functional templates
The ability to construct functional templates for project management procedures is a huge benefit of employing a CRISP-DM methodology. The easiest method to get the most out of CRISP-DM is to create precise checklists for every phase of the process. Applying this to the CRISP-DM approach makes it simple to implement and require less extensive training, organisational role changes, or controversy.
To summarise
The CRISP-DM approach brings flexibility, long-term planning, and the ability to template and repeat. With little need for extensive training or controversy this framework is ideal for those looking to implement any new, simple or complex data-driven projects. That's why when implementing the framework both internally and with our clients we can see results. Allowing us to be confident that we can develop solutions for your data-driven strategies, solve issues and deliver projects that deliver success. Be that improving customer experiences, driving revenue, optimising your data practices or helping you make better use of existing legacy infrastructure.
Other useful links:

Related reads


About Coforge
We are a global digital services and solutions provider, who leverage emerging technologies and deep domain expertise to deliver real-world business impact for our clients. A focus on very select industries, a detailed understanding of the underlying processes of those industries, and partnerships with leading platforms provide us with a distinct perspective. We lead with our product engineering approach and leverage Cloud, Data, Integration, and Automation technologies to transform client businesses into intelligent, high-growth enterprises. Our proprietary platforms power critical business processes across our core verticals. We are located in 23 countries with 30 delivery centers across nine countries.