
In this blog, we outline the various steps involved in the installation and configuration of Apache Kafka on AWS cloud.
Amazon Elastic Compute Cloud (Amazon EC2) is a web service that provides secure, resizable compute capacity in the cloud. It is designed to make web-scale cloud computing easier for developers. Amazon EC2’s simple web service interface allows you to obtain and configure capacity with minimal friction. It provides you with complete control of your computing resources and lets you run on Amazon’s proven computing environment.
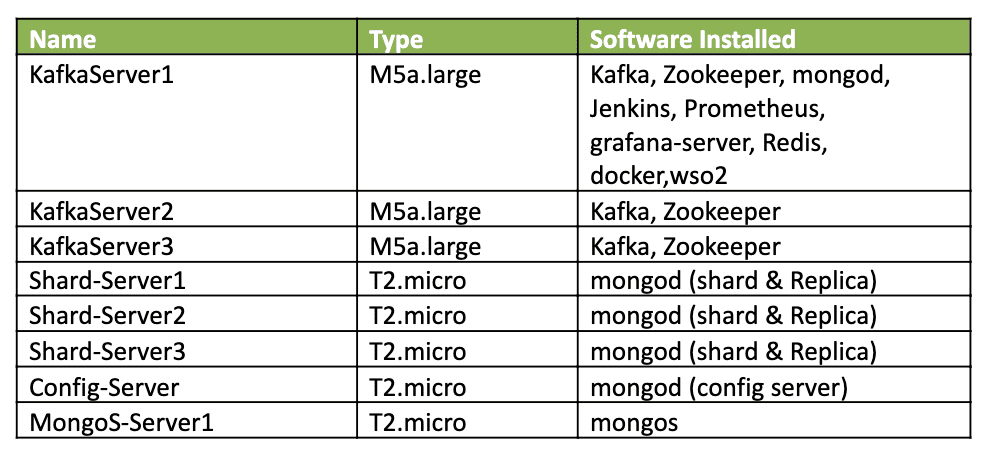
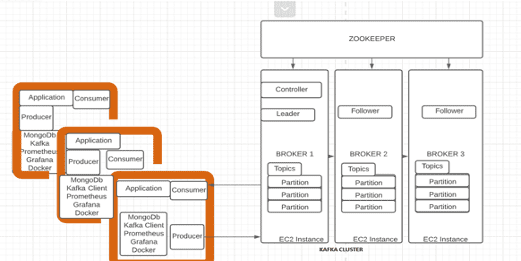
We will be using a total of 8 EC2 instances - out of 8, 3 instances are of type m5a.large and the remaining 5 are of type t2.micro.
Installing Apache Kafka
Apache Kafka is an open-source stream-processing software platform developed by the Apache Software Foundation. The project aims to provide a unified, high-throughput, low-latency platform for handling of real-time data feeds.
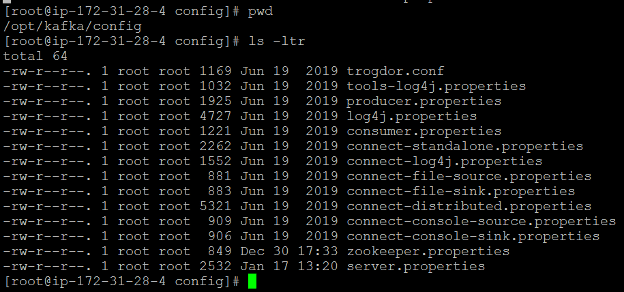
- Kafka config directory on node KafkaServer1: /opt/kafka/config/server.properties
- External & Internal Listener Configurations in KafkaServer1 node:
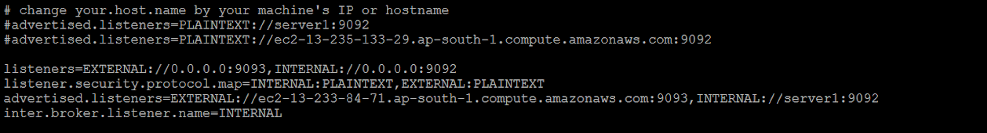
Based on the above configuration Kafka is listening on port 9093 for external communication & on 9092 for internal communication. We did not make the above changes on the KafkaServer2 & KafkaServer3. For our testing in the Coforge environment we have used only KafkaServer1 node. Remaining KafkaServer2 & KafkaServer3 nodes are stopped most of the time.
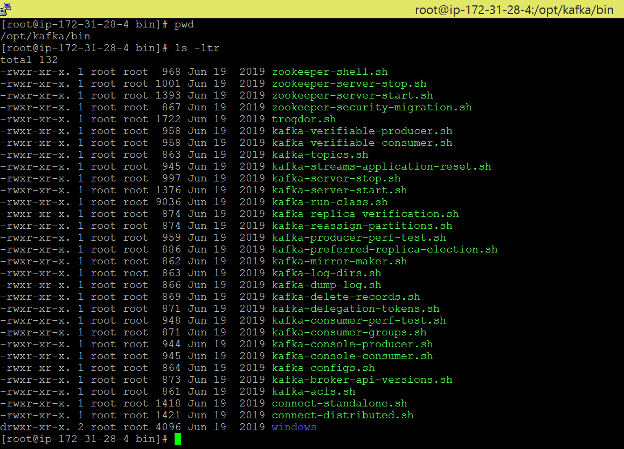
- Kafka Scripts Directory on node KafkaServer1: /opt/kafka/bin
Setting up persistence DB on EC2: MongoDB
- Mongod configuration directory:
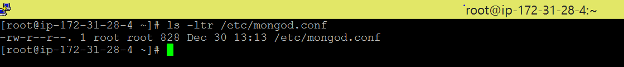
- The only config change in the above file mogod.conf which we made is, bindIp is mapped to 0.0.0.0:

- Mongod is listening on port 27017 on node KafkaServer1 (private ip: 172.31.28.4), to access mongod in kafkaserver1, just execute command mongo (refer to the below screenshot):
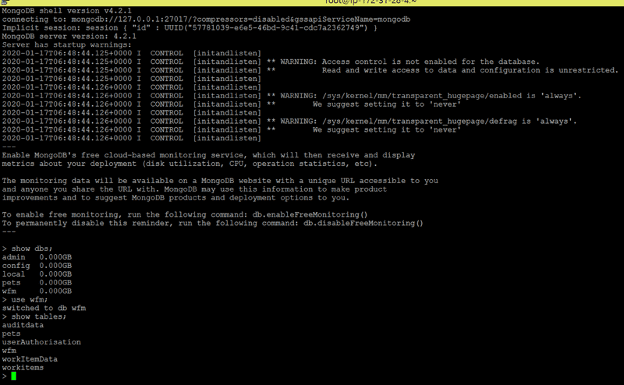
In the above screenshot we can see the table’s auditdata, workitems & userAuthorisation which we are being used for the workflow engine solution.
Prometheus: This is an open-source systems monitoring and alerting toolkit.
Features:
- Multidimensional data model with time series data identified by metric name and key/value pairs.
- PromQL, a flexible query language to leverage this dimensionality.
- No reliance on distributed storage; single server nodes are autonomous.
- Time series collection happens via a pull model over HTTP.
- Pushing time series is supported via an intermediary gateway.
- Targets are discovered via service discovery or static configuration.
- Multiple modes of graphing and dash boarding support.
Components:
- Prometheus server which scrapes and stores time series data.
- Client libraries for instrumenting application code.
- Push gateway for supporting short-lived jobs.
- E for services like HAProxy, StatsD, Graphite, etc.
- Alertmanager to handle alerts.
- Support tools.
- Prometheus is installed in directory: /prometheus/prometheus-2.15.2.linux-amd64 on node KafakServer1:
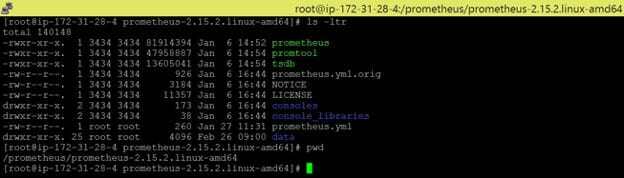
- Prometheus is listening on port: 9099 (refer to the below screenshot)

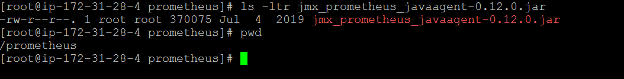
- Prometheus JMX agent which we downloaded to pull the metrics from Kafka node is in the below location:
Grafana: An open source visualization and analytics software. It allows you to query, visualize, alert on, and explore your metrics no matter where they are stored. In plain English, it provides you with tools to turn your time-series database (TSDB) data into beautiful graphs and visualizations.
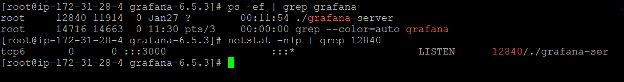
- Below is the Grafana location:
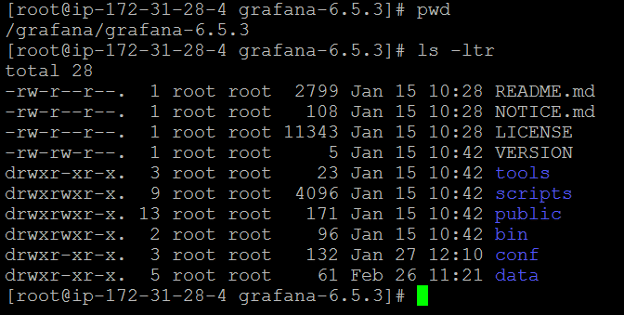
- Grafana is listening on port 3000 in node KafkaServer1 (refer to the screenshot below)
- When calling an external API from the application, the response of the external API exceeds the default setting of the Kafka consumer.
- It takes more than 5 minutes to send a response back from the external API and the consumer rebalances even though it's still running.
- Kafka consumer has a configuration max.poll.records which controls the maximum number of records returned in a single call to poll() and its default value is 500.
- max.poll.interval.ms - If poll() is not called before expiration of this timeout, then the consumer is considered failed and the group will rebalance in order to reassign the partitions to another member.
To overcome this issue we need to change the value of config max.poll.interval.ms to 10 min and max.poll.records to 25 from 500.
Also accordingly, the request.timeout.ms of consumer needs to be adjusted to balance and several rounds of testing done to come up with final config values.
If you would like to find out how to become a data-driven organisation with event streaming, Kafka and Confluent, then give us a call or email us at Salesforce@coforge.com
Other useful links:

Related reads.


About Coforge.
We are a global digital services and solutions provider, who leverage emerging technologies and deep domain expertise to deliver real-world business impact for our clients. A focus on very select industries, a detailed understanding of the underlying processes of those industries, and partnerships with leading platforms provide us with a distinct perspective. We lead with our product engineering approach and leverage Cloud, Data, Integration, and Automation technologies to transform client businesses into intelligent, high-growth enterprises. Our proprietary platforms power critical business processes across our core verticals. We are located in 23 countries with 30 delivery centers across nine countries.