Effective Quality Engineering Identifying & Mitigating Risk
-
Share


Introduction
Effective Quality Engineering Identifying & Mitigating Risk
The fact that all quality engineering organizations, across all industries, are required to limit the level and type of testing needed to meet the high demands of customer satisfaction, with time to market constraints, quality engineering organizations are driven to limit what can be successfully validated. The question is not what testing should be completed; instead, it is what testing can be completed.
If there were no limitations on time, cost, and staff needed to produce and deliver a product, under any production delivery model, it would be possible to test all aspects of the product and ensure 100% quality of product. Software and product delivery have to consider limitations with time, dollars, and staff for every project. The only way to ensure the best quality, given these limitations, is leveraging risk modeling to determine test coverage.
It is common to believe that “because testing is motivated by risk it does not mean that explicit accounting of risks is required in order to organize a test process” this is not true. It is also a common belief that “Standard approaches to testing are implicitly designed to address risks” again this is not true. It is also common to believe that we manage risks effectively by organizing tests around functions, requirements, structural components, or even a set of pre-defined tests that never change.
If quality engineering teams wants higher confidence that they are effectively testing the right things at the right times, risk- based testing is a viable option. RBT focuses and justifies test effort in terms of the overall mission of testing. Leverage RBT when other methods of organizing testing efforts demand more time or resources than can be afforded.
What is risk-based testing
Risk based testing is a statistical based approach to selecting the correct level and type of testing to do on a given project. The fact that Testing often has time, people, and budget limitations is a given in today’s business environment. These limitations do not relieve product teams from the responsibility of delivering high quality products targeted to exceed customer expectations. Exceeding customer expectations is a primary driving factors when determining whether the product and delivery teams are successful.
The answer to the question of what risk-based testing involves is simple. Risk Based Testing is a testing approach that assigns a risk value to all testing activities for a given product under test. There are two primary factors to consider:
- The likelihood of failure
- How critical is the item being tested to the overall operation of the product
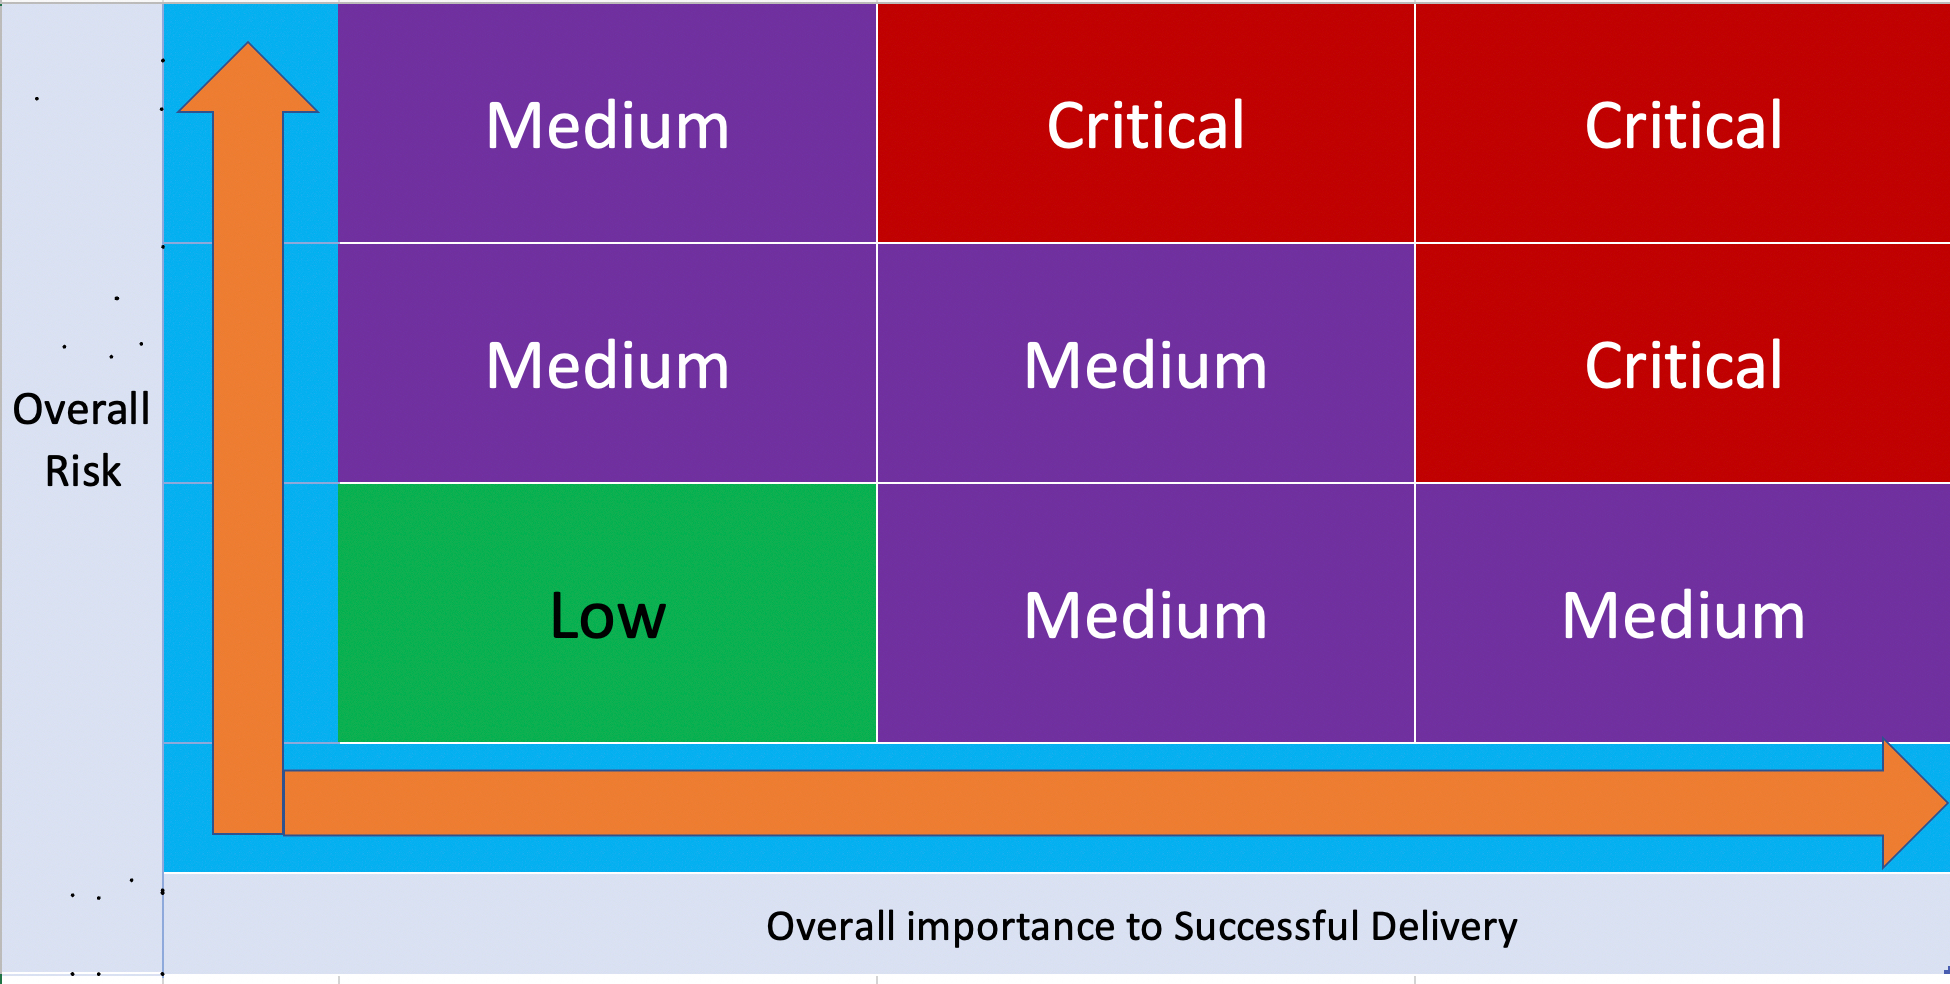
This is a simple set of statements and in most cases, it is that easy. Leveraging a 9-point table to define the risk can be highly effective. Using this table found in figure 1 the functionality of hardware or software is assessed into one of the 9 boxes. The process then must start with a list or inventory of all the items that can be tested. This inventory is a catalog of all testing possibilities and does not contain any priorities associated with it. Using the inventory or list of testing possibilities risk can be assigned and thus priorities can be determined. This is key without risk definition risk-based testing is not possible. The table shows that while the likelihood of failure and the criticality to the operation of the product increase the risk increases.
- Risk based testing is all about identifying risk based on likelihood of failure and criticality to the product or customer
- This is best performed at the requirement or user story phase but can be done at the test case level
- It must be done for regression testing if risk-based testing is new to your team
The process of first cataloging all possible testing conditions and then assessing the risk of each is a risk-based model or testing approach. This process allows QE teams to focus testing design, writing and executing on only those items that reduce the risk to the product. This is not a risk to quality it is a risk to the operation of the product and or a risk to failing to exceed our customers expectation.
How is risk determined?
Definitions
The starting point is always with a definition of risk; however, risk has 3 main components that makeup its definition
- Consequences
- Likelihood
- Approach or actions based on the details of item 1 & 2
Risk must always be defined in relationship to the above 3 areas as it is not theoretical it is based on quantifiable data. Risk is then defined within 2 aspects:
- Risk – a combination of the likelihood and consequences of an adverse event
- Condition – a statement of current key circumstances or situations that may result in an adverse consequence
This then requires that we standardize the following:
- Consequence:
- Consequence – the worst credible impact that may result from an event
- This is the impact to the process, product or customer
- The consequences are always listed based on the worst case scenario
- Criticality – the severity (high, medium or low) of a consequence
- Consequence – the worst credible impact that may result from an event
- Likelihood
- The probability that an event will occur
There is also the requirement to standardize how to represent risk:
- Risk Matrix Standard Scale – a set of standard scales and associated definitions that are used to rank the likelihood of risk event occurrence and the criticality of its consequences.
Approach to Risk:
There are four defined approaches that define the action we take when presented with a risk:
- Accept – as a residual risk
- Watch – monitor for positive or negative trends
- Research – conduct inquiries to better understand the likelihood and consequences
- Mitigate – take action to minimize the likelihood or consequences
Risk Assessment
Assessing risks means determining the effects (including costs) of potential risks. Risk assessments involves asking questions such as:
- Is this a risk or not? How serious is the risk?
- What are the consequences?
- What is the likelihood of this risk happening?
Decisions are made based on the risk being assessed. The decision(s) may be to mitigate, manage or ignore. The important things to identify (and quantify) are:
- What indicators can be used to predict the probability of a failure?
- The important thing is to identify what is important to the quality of this function. This may include design quality (e.g., how many change requests had to be raised), program size, complexity, skill level of all teams including QE, how new the technology, etc.
- What are the consequences if this function(s) fails?
- Very often it is impossible to quantify this accurately, but the use of low medium high critical may be good enough to rank the individual functions or hardware devices.
By combining the consequence and the probability (from risk identification above) it should now be possible to rank the individual functions or components of a system. The ranking could be done based on “experience” or by empirical calculations. A key factor can be knowledge. The two methods of determining if you are using an approach that is dependent on internal working of the product or an approach that is black box is detailed in the section on product knowledge section 6.
The process of define risks and assigning a risk value is only the first step the risk assessment must also allow QE to establish which subset of any of the risk levels are critical to run first. This has always been the 80 20 rules. To make risk-based testing work it is critical to find the 20% of test action in any risk bucket that covers 80% of the risk in that bucket. There are many methods to do this such as pare wise testing or orthogonal array testing. These approaches are somewhat time intensive and should be used as a final filtering approach after QE has establish their foundational approach to risk-based testing.
The following section provide a method of first define what goes in the four buckets, and then which action are the most critical and cover the 80% of the criticality on that bucket.
Determining impacts: What is important?
The need to know the possible impacts resulting from an area to be tested is critical to understanding the impact or danger to the area under test. This means analyzing the most important areas of the product. The following are ways to prioritize risk and provide a foundation. The ideas presented here are not the only valid ones. In every product, there may be other factors playing a role, but the factors given here are a good starting point for our projects.
Important areas can either be functions or functional groups, device or device elements, or properties such as performance, capacity, security etc. The result of this analysis is a list of functions and properties or combination of both that need attention. The next step is the construction or sorting these functions or devices into a descending list from more or less important areas.
Critical areas (cost and consequences of failure)
You have to analyze the use of the product within its overall environment (refer to section 6 for a sample of how to do this). Analyze the ways the product may fail. Find the possible consequences of such failure modes, or at least the worst ones. Consider redundancy, backup facilities and possible manual check of product output by users, operators or analysts. Software or hardware that is directly coupled to a process it controls is more critical than software whose output is manually reviewed before use. Thus, if software or hardware that we test is controlled by other programs or devices the likelihood that any changes in those controlling programs or device will increase the likelihood that a failure will occur in the programs or devices they control. If any software or hardware controls a process, this process itself should be analyzed. The inertia and stability of the process itself may make certain failures less interesting.
Output that is immediately needed during working hours is more critical than output that could be sent hours or days later. On the other hand, if large volumes of data to be sent in a wrong format depending how it is sent, just the cost of correct and or resending may be horrible. The damage may be classified into the classes mentioned down below, or quantified into money value, whatever seems better. In systems with large variation of damage it is better to use damage as absolute money value, and not classify it into groups.
A possible hierarchy for grouping damage is the following:
A failure would be catastrophic
The problem would cause the software or hardware to stop, maybe even lead to crashes in the environment (stop the whole business or product). Such failures may deal with large financial losses or even damages to customer’s satisfaction. An example would be the gross uncoupling of all subscribers to our cable or voice network on a special date. Serious legal consequences may also belong here.
A failure would be damaging
The product may not stop, but data may be lost or corrupted, or functionality may be lost until the program or computer is restarted. An example is equipment that will not work just around midnight on 31 December.
A failure would be hindering
The user is forced to workarounds, to more difficult actions to reach the same results.
A failure would be annoying
The problem does not affect functionality, but rather make the product less appealing to the user or customer. However, the customer can live with the problem.
Visible areas
The visible areas are areas where many users will experience a failure, if something goes wrong. Users do not only include the operators sitting at a terminal, but also final users that dependent on the service delivered by the product which includes the software and hardware. A factor to consider under this heading is also the forgivingness of the users, i.e., their tolerance against any problem.
Software or hardware that is intended for untrained or naive users, especially software or hardware intended for use by the general public, needs careful attention to the user interface (website or set top boxes for example). Robustness will also be a major concern. Software or hardware which directly interacts with hardware, industrial processes, networks etc. will be vulnerable to external effects like hardware failure, noisy data, timing problems etc. This kind of software or hardware needs thorough validation, verification and retesting in case of environment changes. An example for a visible area is the functionality in a phone switch, which makes it possible to make a call. Less visible areas are all the value-added services like call transfer or caller ID. One factor in visibility is possible loss of faith by customers. I.e. longer-term damage that would means longer-term loss of business because customers may avoid products from the company.
Usage frequency
Damage is dependent on how often a function, feature or hardware is used. As the use of a product increases the risk to the release of that product increases. Some functions may be used every day, other functions only a few times. Functional usage is then determined by their usage (how many times the product is used by how many users). Give priority to the products with the heavier usage. The number of transactions per day (video request or voice call) may be an idea helping in finding priorities. A possibility to leave out some areas is to cut out functionality that is going to be used seldom, i.e., will only be used once per quarter, half-year or year. Such functionality may be tested after release, before its first use. Sometimes this analysis is not obvious. In process control systems, for example, certain functionality may be invisible from the outside. In complex systems, there may be a lot of programs or devices used everywhere. It may be helpful to analyze the design of the complete system.
In the following section are some of the key factors that add definition to usage and the factors that increase or decrease the risk of the software or hardware under test.
Unavoidable
Unavoidable is defined as those areas of the product that most or all users use during their normal operations. This means that depending on the product, those applications or devices that are invoked all the time have the highest risk and are the most critical to run tests against.
Frequent
An area of the product that most users will encounter eventually, but maybe not during every usage session. This an area like firmware updates or system maintain to customer delivery systems. The customer does not initiate this action but the potential of impact to the end user is high and thus the risk is high if this is not tested.
Occasional
An area of the product that an average user may never visit, but that deals with functions a more serious or experienced user will need occasionally.
Rare
An area of the product which most users never will visit, which is visited only if users do very uncommon steps of action. Critical failures, however, are still of interest. An alternative method to use for picking important requirements as described. Importance can be classified by using a scale from one to five. However, in some cases this does not sufficiently map the variation of the scale. Then, it is better to use real values, like the cost of damage and the actual usage frequency.
Failure probability: What is (presumably) worst
The worst areas are the ones having most defects. The task is to predict where most defects are located. Analyzing probable defect generators does this. Failure probable is a vast subject an in the following sections some of the most important defect generators and symptoms for defect prone areas are presented. There exist many more, and you must always include local factors in addition to the ones mentioned here.
Complex areas
Complexity is maybe the most important defect generator. More than 200 different complexity measures exist, and research into the relation of complexity and defect frequency has been done for more than 20 years; however, no predictive measures are yet published. Still the most complexity measures may indicate problematic areas. Examples include long modules or new product lines, many variables in use, complex logic, complex control structure, a large data flow, central placement of functions, a deep inheritance tree, and even subjective complexity as understood by the designers. This means you may do several complexity analyses, based on different aspects of complexity and find different areas of the product that might have problems. We can also place here product history. Based on historical data you can add a product, function, device or component here based on the fact of how often they failed in the past.
Changed areas
Dynamic Changes need to be considered. Unexpected or unplanned change may be a defect generator. Often changes are quick and easy, thus not analyzed thoroughly for their impact. Another reason is that changes are done under time pressure and analysis is not completely done. The result is side effects. Advocates for modern system design methods, like the agile or extreme programming, state that debugging during unit test is more detrimental than good to quality, because the changes introduce more defects than they repair.
In general, there should exist a protocol of changes done. This is part of the configuration management system (if something like that exists). Sorting the changes by functional area or device or component; therefore, find the areas, which have had a high number of changes and that these changes caused a major repair to the original design. High levels of changes are also a symptom of badly done analysis. Thus, heavily changed areas may not correspond to user expectations, which means that customer calls the support center increase after most of the release that have the high change index.
Impact of new technology, solutions, methods
The use of new tools, methodologies, technology experience or a new hardware vendor requires a learning curve. In the beginning, they may generate many more faults than later. Products or software, that is new in the company, or new in the market and unstable. Another issue is the technology, which may be new to the engineering and testing teams, or Graphical User Interface libraries. Any new tool or technique may give trouble. A good example is the first project with a new type of user interface. The general functionality may work well, but the user interface subsystem may be full of trouble. Another factor to consider is the maturity of methods and models. Maturity means the strength of the theoretical basis or the empirical evidence. If software uses established methods, like such models may express finite state machines, grammars, relational data models, and the problem to be solved suitably, the software can be expected to be quite reliable. On the other hand, if methods or models of a new and unproven kind, or near the state of the art are used, the software or hardware may be more unreliable. This is as important in test planning, as it is in cost estimation.
Impact of the number of people involved
The more people involved with a software release, the greater the overhead and communication challenges become. A small group of highly skilled engineers is much more productive than a large group of average engineers. Care should be taken when assessing the size, knowledge, and history of the delivery teams.
Impact of turnover
If people move on for any reason, new people must learn the design constraints before they are able to continue that job. This is a key factor for product that is delivered to QE by a vendor. It is also a factor for long team project, as not everything may be documented, some constraints may be hidden for the new person, which may result in defects. In general, areas with turnover will experience more defects than areas where the same group of people has done the whole job.
Impact of time pressure
Time pressure leads to people making short cuts not risk modeling. Risk modeling is an additional time investment and thus by passed for the sake of expedites. People concentrate on getting the job done, and they often try to skip quality control activities, thinking optimistically that everything will go fine.
Time pressure may also lead to overtime work. It is well known, however, that people loose concentration after prolonged periods of work. This may lead to more. Together with short cuts in applying reviews and inspections, this may lead to extreme levels of defects density. The factor here is that time pressures are a way of life in QE and thus we need to reduce this time pressure by risk modeling. Taking the time to determine the risk and testing to cover the risk is the only safe way to address these pressures
Identify targets which need optimization
Shortage of machine and network capacity and memory can not only cost driver but a defect or risk driver. The problem is that may products need extra design effort and using less robust design methods may increase the risk to the product. The dilemma is that extra design effort may take resources away from defect removal activities, and less robust design methods may generate more defects. This is a process area that analysis should address and identify what should be done to remove the risk level from the product delivery. It is not a factor in deciding what to test it is a factor that management will need to do a cost to benefit analysis to drive if changes can be made.
Identify targets with many historical defects
Defect repair leads to change, which lead to new defects, and defect prone areas tend to persist. Experience exists that defect prone areas in a delivered system can be traced back to defect prone areas in reviews and unit and subsystem testing. Our QE experience shows that modules and devices that had faults in the past are likely to have faults in the future. If defect statistics from design and code reviews, and unit and subsystem testing exist, then priorities used to add the correct level of risk and testing order.
One general factor to be considered
Testing as a discipline is done at the end of a product lifecycle. Designers, vendors and developers test before this. It is reasonable to have a look at how these teams have tested the software or hardware before, and what kind of problems they typically overlook. Analyze the unit test quality. This may lead to a further tailoring of the test case selection methods.
Looking at these factors will determine the fault density of the areas to be tested. However, using only this will normally over-value some areas. Typically, larger components will be tested too much. Thus, a correction factor should be applied: Functional size of the area to be tested. I.e. the total weight of this area will be "fault proneness / functional volume". This factor can be found from function point analysis early, or from counting code lines if that is available.
Risk Prediction & prevention
Risk prediction is derived from the previous activities of identifying, planning, assessing, mitigating, and reporting risks. Risk prediction involves forecasting risks using the history and knowledge of previously identified risks.
During test execution it is important to monitor the quality of each individual function or device (number of errors found), and to add additional testing or even reject the function or devices and send it back to development if the quality is unacceptable. This is an on-going activity throughout the test phase. Key to risk-based testing is to ensure that this testing is based on the testing selection you make as a result of the risk analysis you do and the risk the product team is willing to accept.
Significant Metrics
This a brief introduction to metrics used in this document. There are several reasons to use metrics, for instance:
- Return on investment (cost / benefit analyses)
- Evaluate choices, compare alternatives, monitor improvement
- Have early warning of problems, make predictions
- Benchmark against a standard or in competition
This is not a complete picture of use of metrics. The QE teams are now in the process of defining the list of metrics that they use as an organization. This document makes the distinction between metrics used for measuring progress and metrics used for the prediction and probability of faults. The metric used for risk identification and predictions are internal to the testing teams and are shared within test reporting. They are not a dashboard level of metric they are a project level metric.
Metrics for Progress Tracking
Metrics used for measuring progress:
- The number of tests planned, executed and completed
- The number of faults per function
- The number of hours used in testing per fault found
- The number of hours used in fixing per fault (to correct the error and return the function to re-test)
These metrics report graphically, and trend analysis applied. For instance, the information about "test planned, executed and planned" was compared with information about "faults to be fixed and actually fixed". The reason was to have an early warning of a resource problem if the number of not completed tests increased at the same time as the numbers of faults to be fixed were increasing.
Based on the information above, it was possible to calculate "Estimated to Complete" in number of hours, i.e., resource requirements to complete the test project. This was of course very important information in a project based on reducing risk and dynamic resource allocation to the most critical areas.
This information can then be used to size the testing process need to achieve any given risk level. It is not enough to determine the risk that will be inherited if certain sets of tests are run. In our environment we need to address how long any test suite will take in addition to what risk is mitigated and which risks are not covered. The foundation to risk-based test is the ability to size what you can do given the time frames allotted to you and then apply the risk cover and not cover. Risk testing must be an agreed to process. All the members of the product team need to understand the level of risk they are accepting give the testing we will do.
Metrics to predict error and fault probability
A completely different type of metric is used to identify probability of faults in the system. Identifying indicators that were expected to be of importance per function did this. Indicators could be "Changed functionality since previous release", size of function (i.e., number of lines of code), complexity (this could be functional complexity or structural complexity), quality of design documentation etc. A number of 3, 2 or 1 (i.e., low, medium or high) was given to each indicator per function as well as a weight to handle different importance between the indicators.
Now a probability of having a fault could be calculated per function and compared to the other functions in that system. This information should then be combined with information about the consequence of a fault in each function. Based on this information it will now be possible to "rank" the list of functions based on risk exposure (probability and cost of a fault). This then allows us to determine which of the 9 buckets in figure 1 any given test cases or test suite fall into,
Product knowledge
A primary challenge for identifying and determining a risk is directly related to overall process and product understanding and knowledge by the team. Determining if a function or component is critical to the operation of the product is not a trivial for any product. This level of understanding, in many cases. may be limited in some cases to a small few. The fact that this knowledge is critical to risk-based test means that quality engineering organizations must have a method to cover these gaps if they want to use risk-based testing.
Approaches to Analysis
Risk based testing is not new and there are many forms, formulas, models and opinions. I am not trying to provide a comprehensive view of risk based instead to show that risk-based testing can be achieved in QE and CET and that we can achieve our current and future goals if this becomes the focus for 2022. To show the feasibility of risk-based testing considers these two simple views of the discipline.
Internal Product Knowledge
Having insight on how a product is designed and how it works; thus, it begins with details about the situation and identifies risks associated with them. With this approach, a study of a product will require you to repeatedly ask yourself “What can go wrong here?” More specifically, for each part of the product, ask these three questions taken from the sections above:
- Vulnerabilities: What weaknesses or possible failures are there in this component?
- Threats: What inputs or situations could there be that might exploit vulnerability and trigger a failure in this component?
- Victims: Who or what would be impacted by potential failures and how bad would that be?
Using figure 1 the process is to place items into your risk buckets that range from critical to low risk. As stated, this approach requires substantial technical insight, but not necessarily all the testing staff are required to have this insight. In fact, one of the most successful approached risk analyses based on internal knowledge of the product, can done with the development and product teams. This approach can turn black box knowledge levels into gray box knowledge levels. The process begins when QE brings their questions and testing approach; development and product teams bring their insight or view into the product that the QA team does not have. This can look like the following:
Important to consider the applications and question certain aspects of the overall delivery:
- "How does this feature work?"
- The team then should draw and write on the white board the details, as they know them.
- When the QA team communicates that they fully understand the process and how to test it, talk through everything and verbally summarize the understanding as a collaborative activity.
- This process can be repeated until the QA team has full insight into the product and the understanding needed to apply an inside out risk-based testing approach.
Some of the questions that may be asked in this brainstorming approach are:
- What happens when a function fails?
- How does a function get call or invoked
- Can this function ever be invoked at the wrong time?
- What are the error codes that this function returns and when does it return them
This is simple list of questions, the purpose of this type of interface is to separate fact from opinion and know from unknown. Through this one example the goal is that once the risk are identify, the discussion on how we can test to cover these risk is the start of testing based on risk mitigation, not:
- Testing what we can “based on staff and time”
- Testing everything that can be tested
There are advantages to this approach, but it requires effective communication skills on the part of the developer and tester, and a willingness to cooperate with each. This approach also requires time that may not be available based on the project timeframes. It is not the only method; the point is that gray box requires knowledge. This means that QE would need to have a method on getting the required insight that is not covered in requirement and design documents. It is up to the testing management to determine when and where this approach is worth the time and staff investment. This process is not designed for all product types and should be guided by the available of experts, time required and overall cost to benefit of using this approach. This approach is a larger commitment on all teams. This means that time, staff, dollars and benefits must be considered when using this approach to gaining the required knowledge necessary to assign risk to your testing inventory.
Requirement Based Testing
This is a process that identifies potential risks and correlates the risks to the details. This is a more general approach than gray box, and somewhat easier. With this approach, you consult a predefined list of know risks and determine whether they apply to the testing effort under review. The predefined risks should be written down not something keep in tester bag of trick based on what they did before. Sample list that may be used are:
- Quality Criteria Categories
- These categories are designed to evoke different kinds of requirements. What would happen if the requirements associated with any of these categories were not met? How much effort is justified in testing to assure they are met to a “good enough” standard?
- Capability. Can it be performing the required functions?
- Reliability: Will it work well and resist failure in all required situations?
- Usability: How easy is it for a real user to use the product?
- Performance: How speedy and responsive is it?
- Install ability: How easily can it be installed onto its target platform?
- Compatibility: How well does it work with external components
- Other areas that can provide insight in an outside in process are:
- Configurations?
- Supportability: How economical will it be to provide support to users of the product?
- Testability:How effectively can the product be tested?
- Maintainability: How economical will it be to build, fix or enhance the product?
Both approaches support the identification, predictions and impact of risks for any given project and thus allow the product team to decide what risk they will accept when delivering a product to end users.
Creating Operational Buckets
The reason to categorize testing actions (test cases, setup & configuration) into the four levels is to divide these actions into logical operation buckets. The result of having the operational buckets is that you can assign a value for each bucket that contains the following:
- Number of items in the bucket
- The number of staff need to execute the bucket
- Hardware and software requirements
- Lab considerations
- Total time needed to complete the bucket once
- Total number of times the buck will need to be executed “estimated”
- Risk to the product based on not running or incomplete run of the bucket
This approach then allows the team to apply risk-based testing into overall test planning and reporting. This will then reduce ambiguity in the testing results. QE can report specific risks to the product delivery and the probability or likelihood that the risk will happen in the field. Creating buckets must be part of our risk-based testing model.
The integration of risk-based testing into the QE operational process does not require a large investment form the testing teams. The process is to ensure that you have a clear understanding what the products under test are and what they do. Risk based testing starts with analysis of the products and ends with how well the product preforms in the field.
The starting point then is to first determine what types of risk are most critical to the release or component under test. This information is foundational to implementation. Appling the analysis definitions in section 4 you can catalog all testing into a risk level. The level and type of product knowledge as described in section 6 allows you to determine the criticality and the likelihood of failure. It is where any risk met in these two axes’ that determines the level of threat.
- Critical
- Medium
- Low
Cataloging tests into categories based on priority and risk helps identify the level of effort needed for effective test coverage.
Conclusion
The focus must be to staff and fund major process improvements such as risk-based testing to effectively improve efficiency and reduce delivery and cycle times. Important to ensure that continuous process improvement and deep knowledge of the business processes, development methodologies, and overall code base is in place.
Important to remember that, while some of the risk factors may be complex. defining the process is straight forward. The following list of action is the same and does not vary regardless of the complexity or criticality of the risk.
Identify opportunities to mitigate risk:
- Determine overall test coverage needed, based on code and system impacts), prepare relevant test cases, shift resources to gather information
- Maintain traceability across requirements, code and system changes, identified risks, and targeted tests.
- Monitor and report the status of risks as the project evolves.
- Assess overall testing coverage, given a set of risk-based tests. Find holes in the testing effort.
- If a risk is determined to be minimal, document it, and target other areas.
- On retesting an area, evaluate your tests experiences so far to determine what risks they were testing for and whether more powerful variants can be created.
- Do at least some non-risk-based test activities, to cover yourself in case your risk analysis is wrong.
- Build lists of bug histories, configuration problems, tech support requests and obvious customer confusions -- deepen your lists of failure
Remember that the risk-based testing is based on overall risk related to:
- Operation of the product
- Usability of the customer
- Validation of regulatory requirements
Risk can be successfully mitigated with clear understanding of potential failures and the associated impacts. Risk is further mitigated by understanding the relationship of where, when, and why systems and services have failed in the field and the likelihood these failures will occur again.